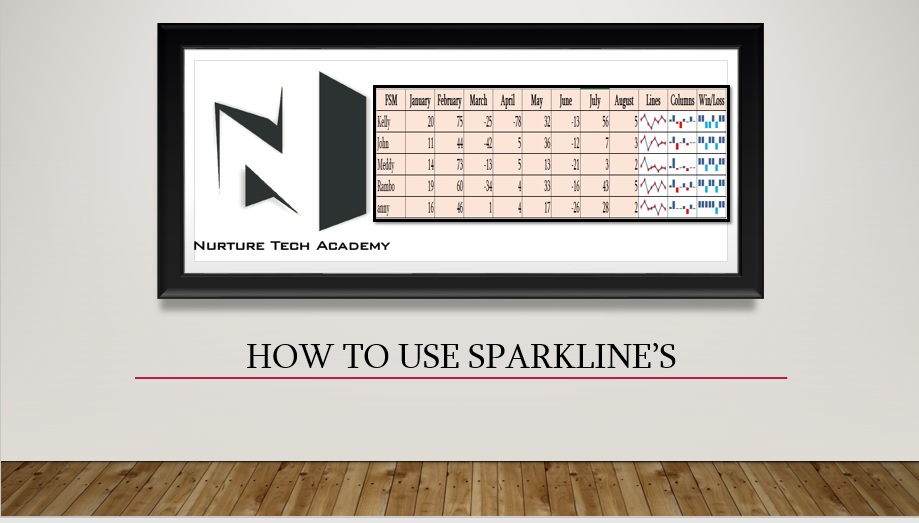
Sparkline Function In MS Excel
How to use Sparkline in Excel? Charts are the Graphical visualization in excel which help us to understand the weekly, monthly performance and consolidated report of entire data, However if we have a data in to tabular form and we need to visualize our data next to each row and if we apply charts it …
